Beautiful Visualizations
Create stunning reports and charts that make visualizing the health of your business easier. Get the data you need in a format that is easy to understand.
Create stunning reports and charts that make visualizing the health of your business easier. Get the data you need in a format that is easy to understand.
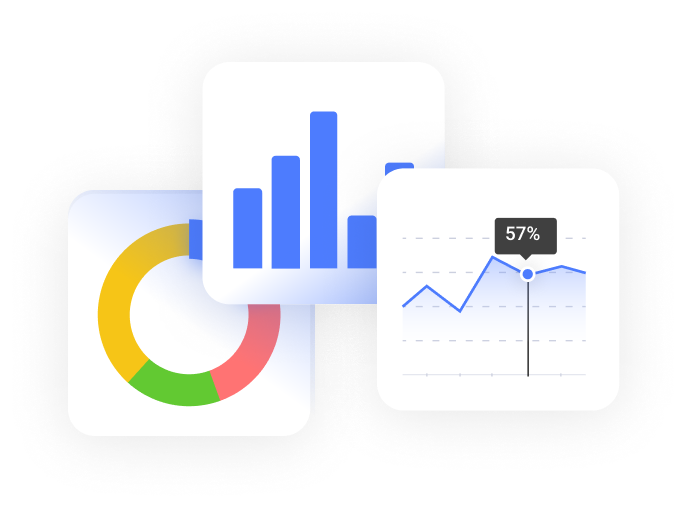
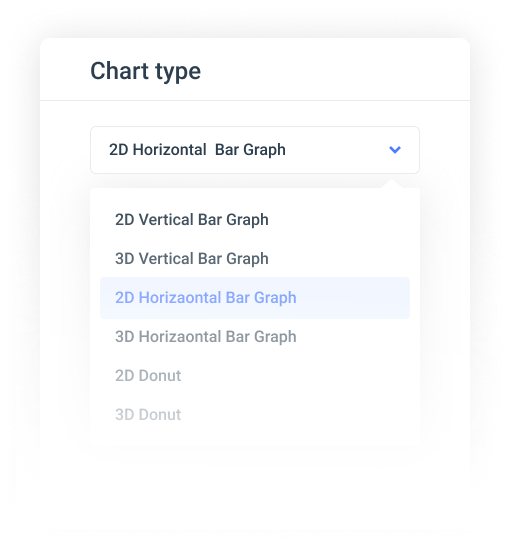
Variety of charts available to visualize data.
Pie, Funnel, Bar, Gauge, pyramid, and donut.
Pivot report tables with drill down allow managers to easily spot trouble areas and trends.
Visualize the company health in numbers and charts, all on a single page. Create comprehensive dashboards.
Create custom dashboards with a variety of chart types. Pie, funnel, bar, and gauge. Just a few of the chart visualizations that can be created.
Slice & Dice information in real-time. Compare sales rep performance and marketing channel ROI.
Build complex pivot reports to allow for deep analysis. Keep an eye on built-in sales and marketing KPIs.
Users can personalize reports and charts to give them the insight they need to keep key accounts happy.
Manipulate data easily in real-time by modifying filters on the fly. View your data from different vantage points.
With access to all data in CRM.me, users can build complex reports, allowing them to easily spot trends and patterns.